Chapter 7 Measuring Ad Effectiveness
In order to improve marketing activities, companies use specific user segments to show them advertisements fitting the user’s interest. To be more concrete; users visiting car sites are more likely to see BWM or Daimler-Benz ads.
7.1 Current state of digital measurement
So far this sounds great. It is a win-win situation, advertisers reach an audience with an interest in their product and users see ads that mirror their interest. Well the key is; advertisers want to increase their advertising effectiveness. Let’s have a look at how advertising is measured. Let’s exemplify it by looking at the advertising for a car with two segments; a segment of car enthusiasts and a general population segment. Both segments receive the same ad.
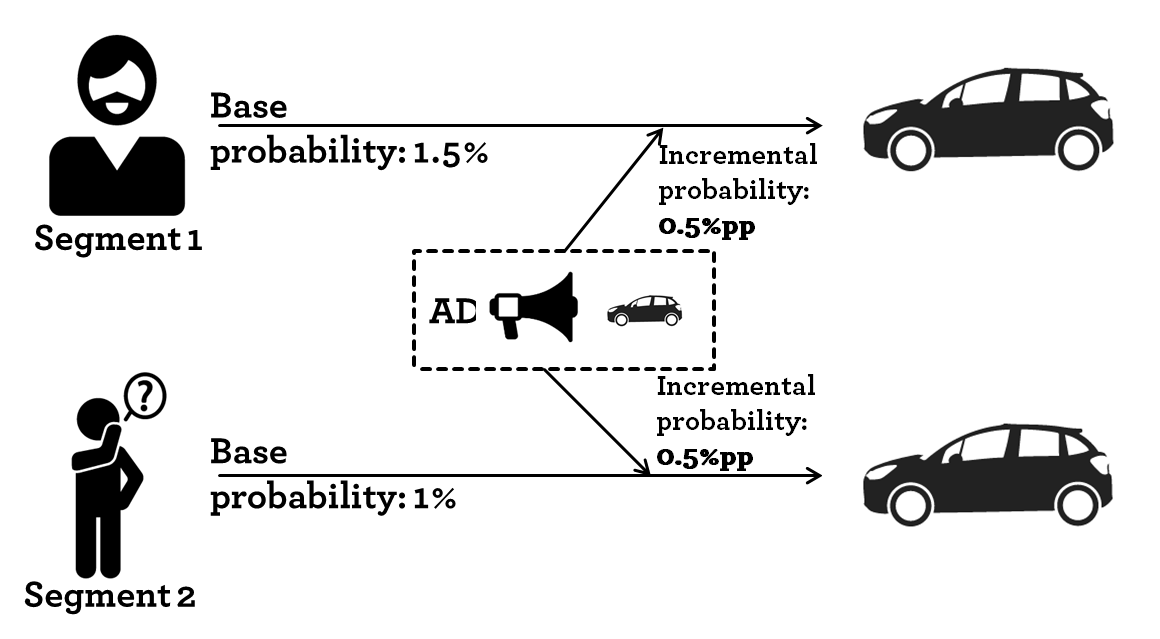
An example of two user segments
The most common (and maybe intuitive) way to look at advertising effectiveness is by calculating the cost per order/conversion. The calculation is straight-forward. The cost per order is: the ad spend by user segment divided by the number of orders generated in the user segment.
As segments are generated depending on the user interests, it is fair to assume that users have different base probabilities of buying the item (car) in question.
| User segment | #User | Base probability | Ad uplift | Ad Spend | #Orders | Cost per order |
|---|---|---|---|---|---|---|
| Car enthusiast | 100 | 1.5% | 0.50%pp | 10 000 € | 2 | 5 000 € |
| No Targeting | 100 | 1.0% | 0.50%pp | 10 000 € | 1.5 | 6 667 € |
Given the example, a naive marketeer concludes that targeting the car enthusiast segment is more effective as the cost per order is 1 667€ lower.
However, that is only the easy way of calculating it. What you as a marketeer really want to measure is the incremental uplift. The uplift describes the increase in purchase probability when showing the user ads. The incremental uplift is only measurable by running (controlled) experiments, in which you measure the increase of sales in the segment exposed to ads to the “same” segment not exposed to ads. Such controlled experiments are rarely done on a segment basis.
In this example, both marketing activities have the same incremental uplift in purchase probability (0.5%pp). Hence, if you ignore that the marketeer has to buy targeting data on top of her media spend, the incremental uplift is the same for both groups as is the return for the ad investment.
This brings us to the key message; current systems (ad serving in particular) are designed in a way that they are basically unable to capture users base purchase probability. Hence, they are deeply flawed and purposefully biased towards benefiting targeted ad buying.
7.2 Incremental ad effectiveness
In the last chapter, we discussed how the current digital measurement approach is biased towards targeted ad buying. The key reason is that ad effectiveness is calculated on a cost per order/conversion basis. As particular user segments -which are addressed with digital targeting- have a high base purchase probability, the segment looks more responsive. Due to insufficient experimentation and proper measurement, the budget optimization tries to reach users who are likely to order/“convert” anyway. Hence, it ignores incremental effects and instead focuses on overall purchase probabilities, mixing base purchase probability and ad-driven incremental effects.
Let’s go back a step and have a look at two scenarios. Scenario A is taken from the previous post. There are two user segments; a segment of car enthusiasts and a general population segment. Both segments receive the same ad. The car enthusiasts (Segment 1) has a higher base probability of purchasing a car. As discussed, that leads to a lower cost per order for that group and sub-sequentially to a misguided budget shift.
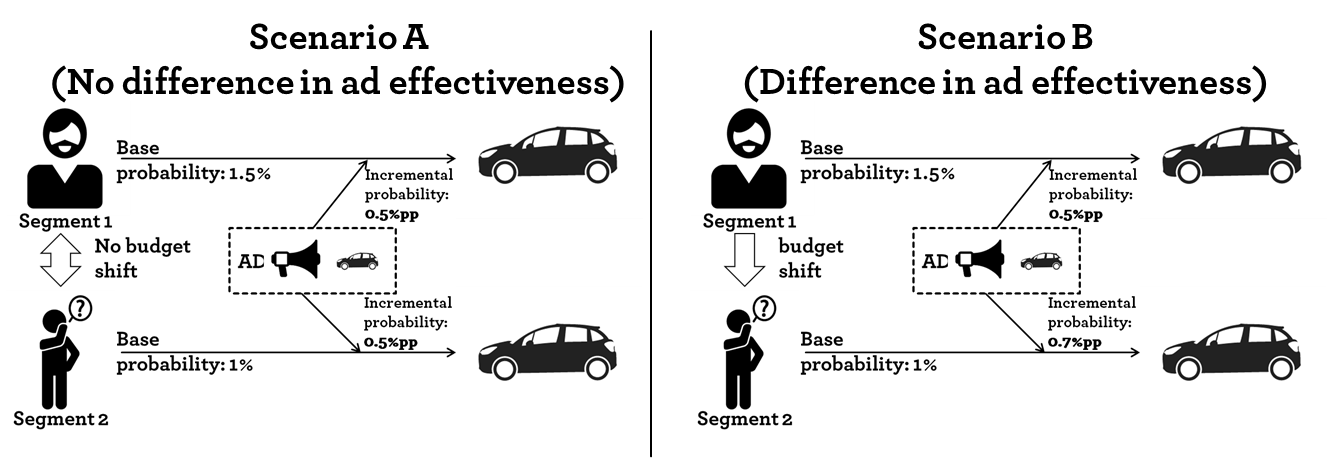
Example of ad effectiveness
Let’s add the second Scenario B. In this case the incremental effect of showing an ad is higher in the general population segment (Segment 2) compared so Segment 1. It might be that the ad communicates a new feature (Matrix LED lights, head-up-display,…) that Segment 1 was not aware of before. In that scenario a budget shift would increase the overall sales. However, that budget shift would only be realized if the incremental effect would have been measured. The cost per order is still lower for Segment 1.
To sum up, current systems try hard to minimize the cost per conversion. This leads to showing ads to users who are likely to convert anyway, if possible. From a theoretical point of view, (e.g. assuming that targeting works perfectly) that leads to an overall decreasing ad effectiveness.
7.2.1 Ad effectiveness a Google Adwords example
In the last two chapters, we discussed how measurement and false metrics drive optimization towards low hanging fruits and in the end degrade ad effectiveness. The next paragraph details short example of how the issue extends into the paid search (e.g. Google Adwords) channel.
Search traffic is split up into two parts; the organic, free traffic and paid traffic. The following chart illustrates the difference.
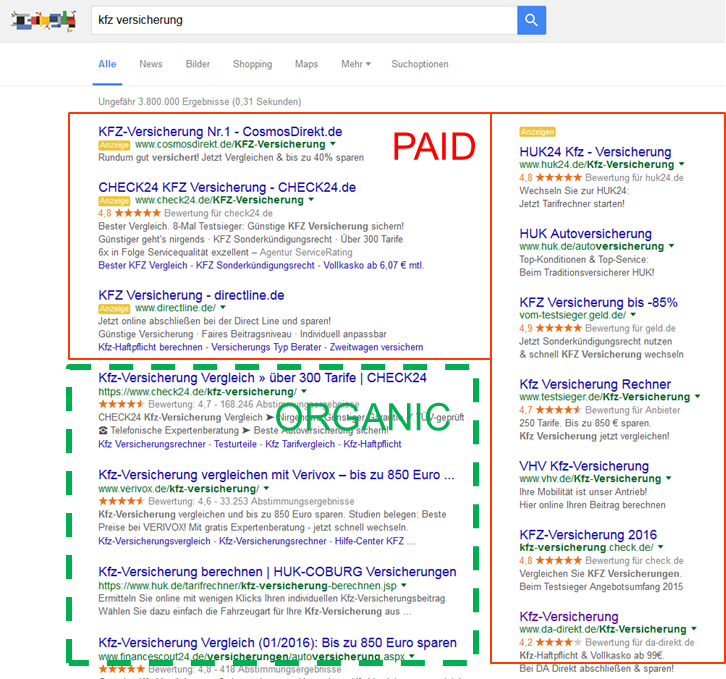
Paid and organic search traffic
For the paid part advertisers are allowed buy individual keywords (search terms that users might type in) on a cost per click basis. Each keyword sells for a different cost per click depending on competition, relevancy and click-through-rate. Usually the advertiser picks the keywords with lowest cost per click.
Keywords can be clustered into at least two broad categories: Brand and Generic keywords. Brand keywords contain the brand name of the advertiser while generic keywords do not and just relate to an (unspecific) inquiry. From a consumer journey perspective, generic terms are searched in the beginning of a purchase decision process, while brand keywords are used towards the end. Generally, that means that brand keywords have a much lower cost per click than generic keywords. Hence advertisers buy brand keywords all the time.
7.2.2 The digital advertising industry avoids discussing the increment
It is safe to assume that advertisers are organically listed in the top positions for brand keywords, while they might not even appear on the first results page for generic terms. As paid advertising is shown above the organic section a majority of users click on the paid links. Hence, an advertiser buying her “own” brand keywords is cannibalizing her organic, free traffic with paid search traffic.
The following chart illustrates this:
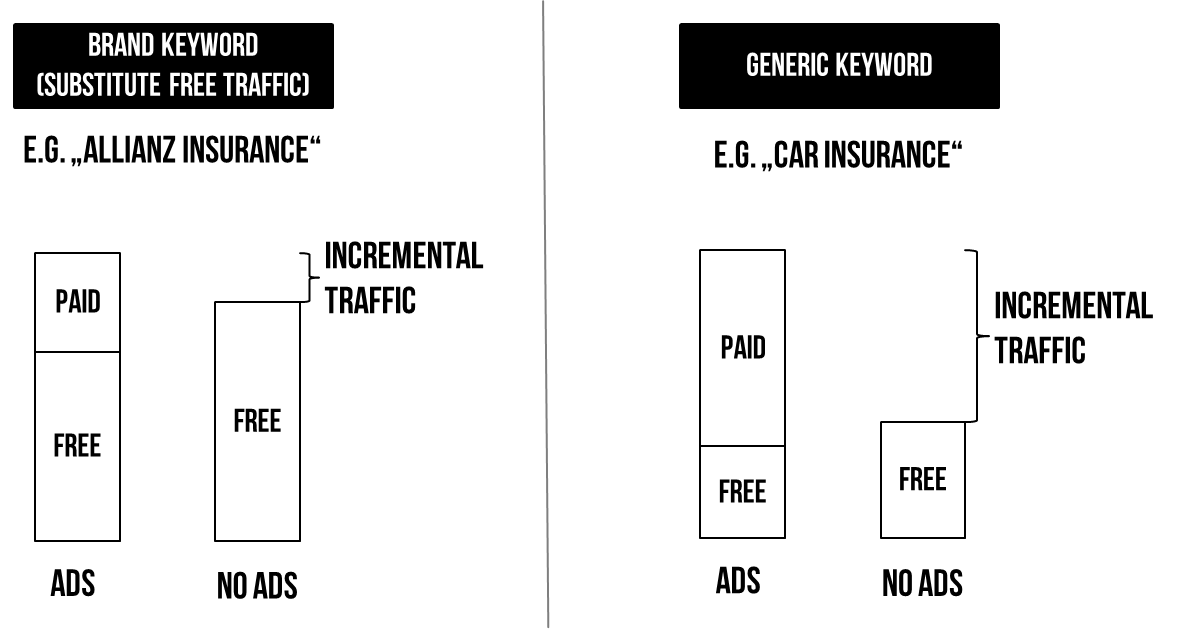
Example of brand and generic keyword buying
The share of incremental traffic for buying generic keywords is much higher compared to buying brand keywords. Using proper experimentation one can figure out what that share is and calculate the cost per incremental visitor as a more reliable metric.
The question arises why this is usually not done. I see three main reasons: (i) incentives, (ii) additional work and (iii) Google’s quality score.
For the team managing paid search it is much easier to communicate low costs per click (CPC) readily delivered by the system compared to relying on a derived metric that needs constant experimentation. As most people are familiar with CPCs they are also commonly used to benchmark channels and/or team performance. Hence increasing CPCs is a difficult story to tell. A part of the cost per click on a keyword is determined by the quality score, Google assigns to an individual advertiser. The lower the score the higher the cost an advertiser has to pay per click. Even though Google does not openly discuss the algorithm behind the quality score5, it is pretty clear that the Click-through-Rate (which is higher for brand keywords) improves the score. As a result of their policy brands are forced or at least given a decent incentive to buy their brand keywords.
To sum up, in the paid search channel, the system is designed in a way to ensure that brands buy keywords for users who are very likely to click/convert anyways.
7.3 The attribution discussion - a smoke screen
In contrast to facing the challenge of measuring incremental ad effectiveness, the dominating advertising technology companies have built a smoke screen labeled attribution.
Attribution modelling is the process of identifying a set of advertisements that influence individuals to engage in a desired behavior (referred to as conversion), and then assigning a value to each of these advertisements.
The goal is to provide a level of understanding of which ads, in which channels, what combination of ad displays, and in what particular order work best to influence individuals to buy. As we cannot influence particular individuals but rather increase purchase probability, the key question can be re-phrased as: how does an advertiser increase the conversion (or purchase) probability? In order to evaluate touchpoints/media channels, we want to measure the incremental (additional) purchase probability of showing a specific ad.
The so-called rule-based model attribution models dominate the current discussion. Most clients agree that a last click attribution model (the last click/interaction gets all the credit) does not fully describe how users behave and is biased towards lower funnel activities (remarketing, affiliate, brand keywords). As an alternative, clients might also discuss and arbitrarily choose one of the following rule-based models.
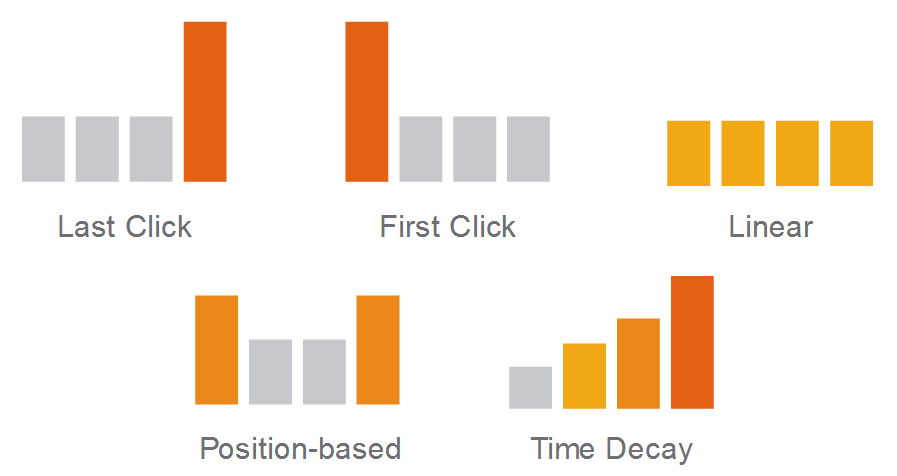
Commonly discussed attribution models - credit to Google
The key problem with all rule-based approaches is that they do not measure incrementality but distribute all (digital) conversions between the digital channels. As a consequence, digital channels take credit for all offline (non-measured) activities as well as the conversions that would have happened anyways.
Digital data trails allow profiling users according to their individual interest and intent. If users are correctly profiled, one needs to assume that their propensity to buy is higher compared to the baseline. Current attribution approaches do not take a user’s base probability to purchase into consideration. Hence, the attribution mixes base probability and the increase due to showing ads.
In order to properly model it, we need to compare users who converted to the non-converters. Ideally the users are basically identical in terms of demographics, interest, intent, etc. However, current ad serving systems do not measure users who do not convert.
Another alternative work-around to this issue is to add “no-show” or “blank” ad impressions to the mix in order to get the uplift per ad impression. In the one setting users see an ad (group A). In the other setting, similarly targeted users see a blank ad impression (group B). The difference in the purchase probability between the A/B group is the incremental effect the ad had.
As a conclusion: Attribution is the industry response to avoid discussing incremental ad measurement. Advertisers need to either invest in alternative measurement systems and/or implement proper A/B-test settings to distinguish between base probability and ad effectiveness.
Questions that advertisers need to ask:
- Do I need to measure incrementality?
- How can I measure incrementality especially in digital channels?
- How can I can I compare advertising performance between digital and offline channels?
- What are the right optimization metrics for my digital channels?